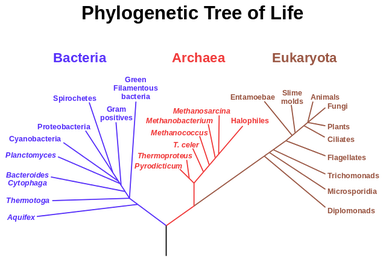
Figure 1. Here is a phylogeny showing the three domains.
What is Phylogenetics?
Phylogenetic trees are used to look at relationships within or among species. These trees are usually created from sequenced data (such as DNA, RNA, or proteins). They can be a useful tool when looking at genomic comparisons. Each tree contains nodes that connect branches. The nodes represent a speciation events, gene duplication events, or birthing events depending on what type of tree you are looking at. At each node the branches coming off of them represent a new species or a variation in sequence data. These trees can be constructed in several different ways, such as; maximum likelihood, maximum parsimony, bayesian, and using distance matrix (1).
Maximum likelihood revolves around determining what is the most probable changes given the parameters of the tree, focuses on what are the most probable sequences. It is representative of all the possible information about the parameters. The nice thing about these trees are that you have known assumptions that you can evaluate and make better. An issue with this method is that it can be very computationally demanding (1).
Maximum parsimony trees are made so that there is the least amount of evolutionary changes possible. It is calculated by assigning a character state at each node on the tree, this is the number of changes needed at that site. This is done for every node and the tree with the overall lowest number of changes is the tree selected. These trees are easy to interpret, but they make assumptions and don't take into account any known knowledge being compared (1).
The bayesian model is similar to that of the maximum likelihood, except that all the parameters are considered to be random variables. The parameters are given statistical distributions, unlike unknown fixed constant values, as in maximum likelihood. The bayesian method gives results that are easy to interpret, but computationally demanding (1).
Distance matrix trees are made up by analyzing substitution rates and then comparing that to genetic distances between sequences. This method is computationally efficient, it does not require comparing many trees. It is good for analyzing large data sets, but can give poor results when comparing divergent sequences (1).
*More detailed information on how phylogenetic trees are created can be found in reference 1*
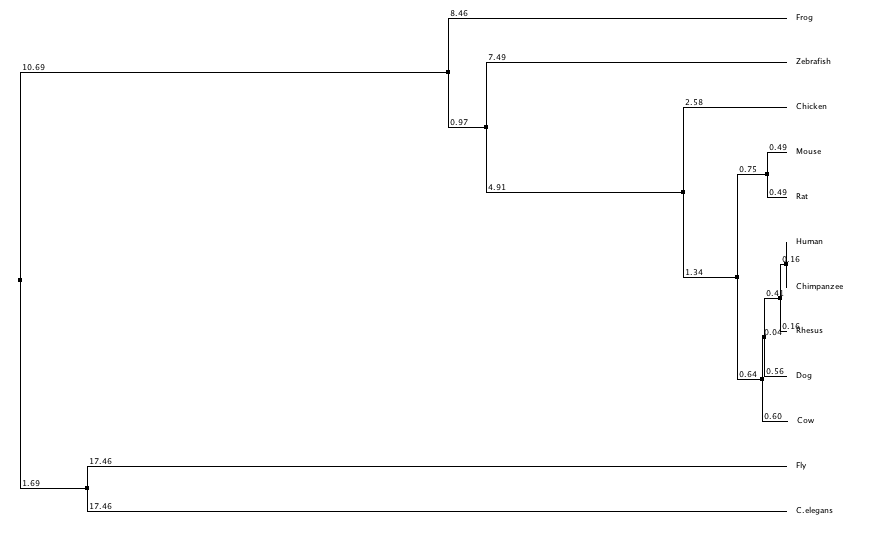
Figure 2. Average distance using percent identity.
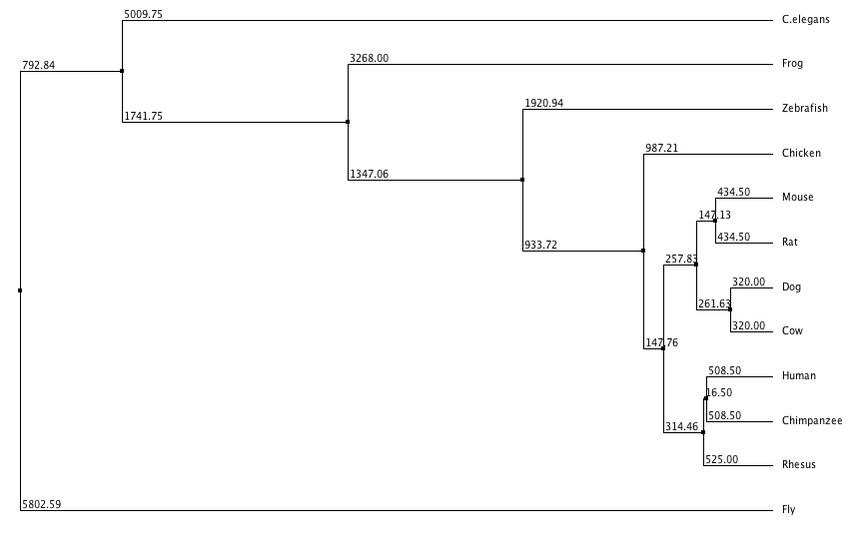
Figure 3. Average distance using BLOSUM62.
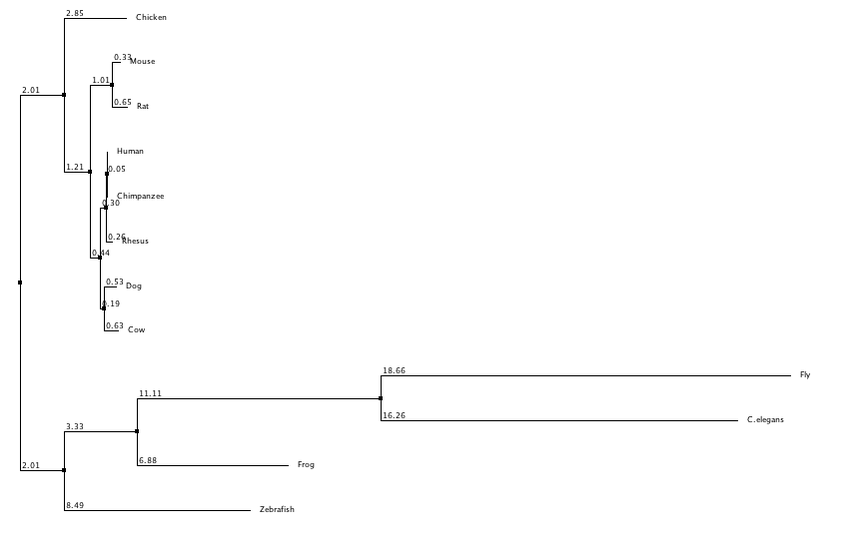
Figure 4. Neighbor joining using percent identity.
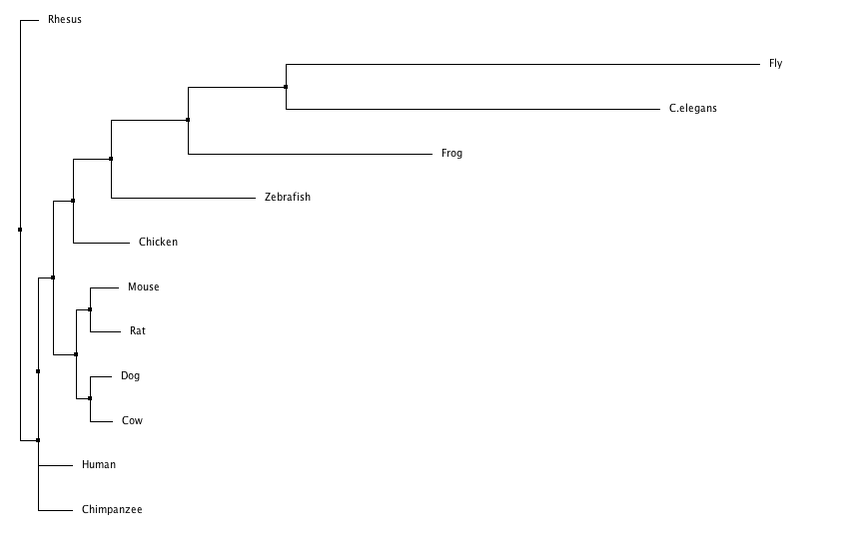
Figure 5. Neighbor joining using BLOSUM62.
What do these phylogenies tell us?
In this trees I have separated them into neighbor joining and average distance, with using percent identity and BLOSUM62 to create the trees for each category. Neighbor joining uses a distance matrix to form a bottoms up approach, and the average distance uses an average of the genetic distance between sequences. BLOSUM62 scores the likelihood of an amino acid sequence, while percent identity focuses on matching identical sequences. From these trees I generated it appears that flies and c. elegans are the least related to human LPHN3, while chimpanzees and rhesus are the most similar which was to be expected. Dog and cow appear to have grouped together along with mice and rats. Although they all share the same domains (besides flies and c. elegans) there appears to be a distinction between mammals and non mammals.
